
Indonesia Records USD 16.31b Trade Surplus on Nickel, Palm Oil
- 02 Jul 2026 20:15 WIB
- Voice of Indonesia
Key Points
- BPS records USD 16.31b non-oil trade surplus for January-May 2026.
- Non-oil exports grow 3.89 percent, contributing 95.52 percent of total national exports.
RRI.CO.ID, Jakarta - The Central Bureau of Statistics (BPS) reported positive trade performance in Indonesia’s non-oil and gas sector from January to May 2026.
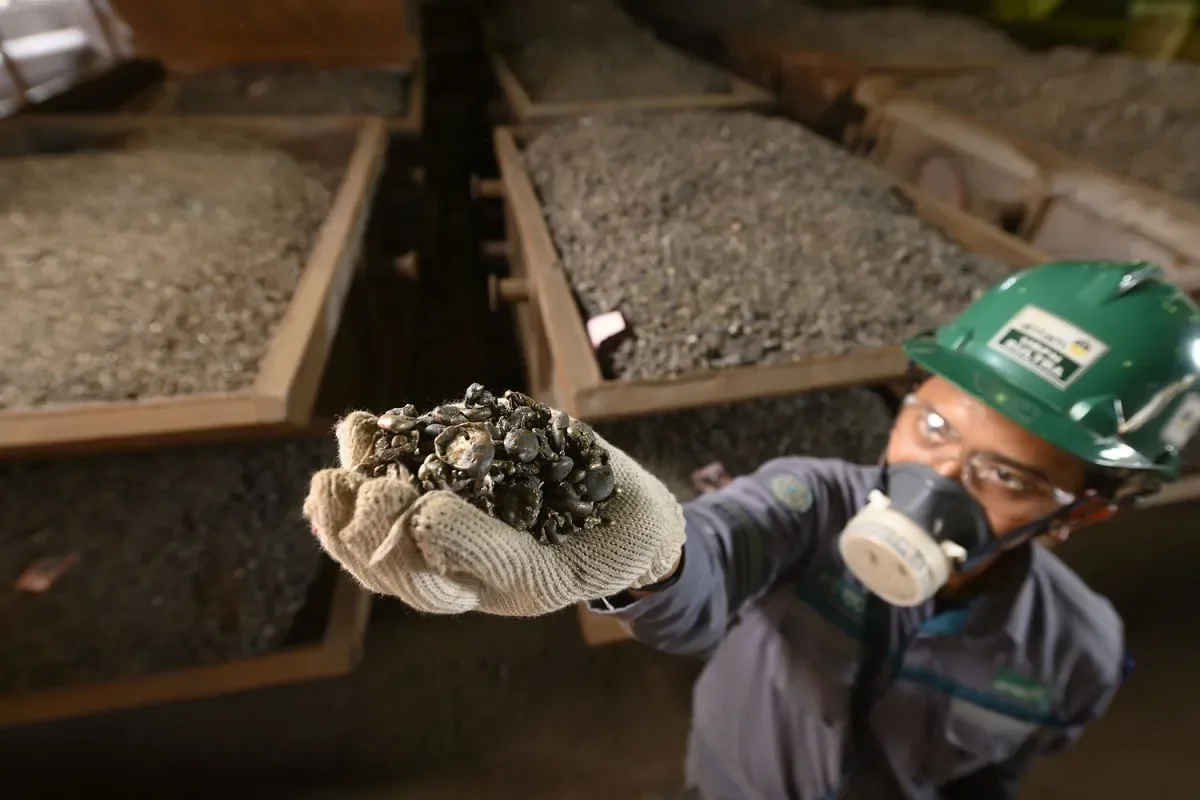
The non-oil and gas trade balance recorded a surplus of USD 16.31 billion, supported by rising exports of processed industrial commodities such as nickel and palm oil.
BPS head Amalia Adininggar Widyasanti said the surplus was driven by non-oil and gas exports totaling USD 110.19 billion, exceeding imports of USD 93.88 billion. “The non-oil and gas trade balance surplus through May 2026 was driven by solid export performance across various sectors,” Amalia said in an official statement on Wednesday, July 1.
Overall, non-oil and gas exports grew 3.89 percent compared to the same period last year. Their contribution also became more dominant, reaching 95.52 percent of total national exports, up from 94.71 percent last year.
The manufacturing sector was the main contributor, with export value reaching USD 94.62 billion, up 6.80 percent year-on-year. Key commodities driving this growth included processed nickel products, palm oil, and natural resource-based chemical products.
Exports of processed nickel were among the fastest-growing, reaching USD 5.41 billion -- a 61.06 percent increase from the same period last year. Palm oil exports reached USD 11.50 billion, up 8.58 percent.
Other commodities also recorded significant growth, including agriculture-based organic basic chemicals at USD 4.99 billion (up 21.39 percent) and other inorganic basic chemicals at USD 1.38 billion (up 84.34 percent).
China remained the primary market for Indonesia’s non-oil and gas exports, with a value of USD 28.54 billion, up 17.68 percent year-on-year.
ASEAN followed at USD 22.13 billion, the United States at USD 12.73 billion, the European Union at USD 7.99 billion, and India at USD 7.43 billion. Meanwhile, non-oil and gas imports totaled USD 93.88 billion.
The three main import commodities were machinery and mechanical equipment (USD 16.16 billion), electrical machinery and equipment (USD 13.95 billion), and plastics and plastic products (USD 4.92 billion), together accounting for 37.31 percent of total non-oil and gas imports. (Gusti Panji)
News Recomendation
Loading latest news.....